KAREN E. HUFF
COMPUTER WEAVING: MODERN TECHNOLOGY CONFRONTS AN ANCIENT CRAFT*
As both a handweaver and a computer scientist, I am always interested in ways to apply the power of the computer to the study of weaving. So, when I had an opportunity to experiment with the capabilities of a plotter, I saw a chance to study textile structure through diagrams drawn by computer. Other computer applications in weaving have been pursued1, 2, but none had attempted to exploit the potential of the plotter as the primary visual output device.
Mention of plotters almost automatically raises visions of graphs, maps, and 3-D perspective views. Because these are the typical uses of a plotter, these are also the applications for which support packages have been developed to make the plotter more accessible. But this accessibility tends to channel potential plotter use along these already well-traveled paths.
What is obscured is the fact that a plotter is a general purpose line-drawing device. After all, everything it can do is accomplished with two primitive functions, drawing a straight line and moving to a new position without drawing. The weaving application I had in mind might demonstrate the usefulness of the plotter in a non-traditional role. With a big smile, I told my colleagues at the Kansas State University Computing Center that I was going to "teach the computer to weave."
Historical Loom-Computer Connection
That computers should now be used in textile applications merely brings full circle the historical connection between looms and computers. Charles Babbage (1792-1871) conceived the idea of a general-purpose, programmable computer around 1833, attributing his inspiration directly to the Jacquard loom.3 The pattern woven by a Jacquard loom (invented in 1805) is controlled by a string of pasteboard cards laced together and processed sequentially, with the woven pattern determined by the arrangement of holes punched in the cards. Here is the origin of the punched card concept!
With the Jacquard loom in mind, Babbage envisioned a computer with a string of program cards directing sequential arithmetic operations according to punched holes and a string of data cards specifying the operands of the calculations. Babbage realized that the Jacquard card system could be used to store coded information to achieve the mechanical actions needed to drive his 'Analytical Engine.' As a contemporary commentator wrote, "We may say most aptly, that the Analytical Engine weaves algebraical patterns just as the Jacquard loom weaves flowers and leaves."
Plots of Textile Structure
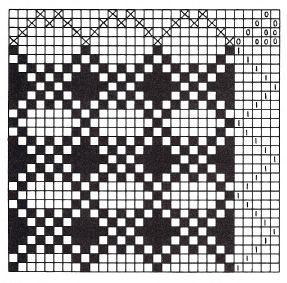
The inspiration for my experiments was to capitalize on the unique line-drawing capabilities of the plotter to diagram a new representation of textile structure. The traditional graph-paper approach (Figure 1) shows the three essential elements of the weaving instructions—threading, tie-up, and treadling (collectively, the draft)—aligned around the cloth diagram. This cloth diagram shows the exact interlacement of the (vertical) warp threads with the (horizontal) weft threads. Each warp-weft crossing is represented by a square on the graph paper, white if weft crosses over warp, black if warp crosses over weft. While this representation shows the design clearly, it doesn't look very much like fabric.
What if, instead, the cloth diagram were to use lines to represent the individual warp and weft threads, with breaks showing where some threads cross under others? Such lines, if drawn with a broad point pen, might look much more like the threads of actual fabric magnified for study purposes. Would such a representation, with its totally different appearance, shed more light on the nature of weaving structure and how that structure can best be exploited in the design process? That was the central question for my experiments.
Weaving Structure Fundamentals
In order to be able to write a computer program to plot such a textile illustration, I had to be thoroughly familiar with the basics of weaving structure myself. So I reviewed these fundamentals. The essence of structure reduces to a pattern of warp and weft crossings—where does the warp cross over the weft, and where does it cross under?
Handweavers can look at fabric structure from one of two points of view. Given a complete draft, a weaver will want to know what the structural appearance of the woven fabric will be like. This question is answered by writing down the threading, tie-up, and treadling on graph paper and working out the cloth diagram. Weavers find this fairly straightforward, since it amounts to imitating the actions of the loom as successive groups of warp threads are raised so that the weft thread may pass under in its back-and-forth course.
On the other hand, it is not uncommon for a weaver to admire a piece of fabric, handwoven or not, and want to know how it could be woven. In this case, there is only the cloth diagram represented by the finished fabric itself; this must be copied onto graph paper, and then the threading, tie-up, and treadling can be generated from it. Without the natural parallels to the physical process of weaving, this task is rather abstract and therefore rather more tedious.
In both cases, there is a simple repetitive procedure to follow in generating the missing element from the information at hand.4 This skill of 'weaving on paper' should be in every handweaver's repertoire, and this skill was exactly what I wished to embody in a computer program which would plot textile structure. 'Weaving on paper' has all the negative attributes of a rote hand operation—it is tedious, time-consuming, and prone to error. Therefore I expected a bonus for transferring it to an automatic computer operation, a bonus in accuracy and ease-of-use.
Computer Implementation
Because all the weaving data fits so naturally into two-dimensional array form, designing and writing the program was straightforward. By taking advantage of the language features in PL/1, I was able to design an input form easy for weavers (or naive computer users) to work with. Almost all of the plotting was accomplished with the two plotting primitives; the only other plotting function used was the one which plots text annotations. Because so few plotting support routines were needed, it made sense to enjoy the use of PL/1 and fake the expected Fortran calling protocol as needed. The program was developed on an IBM 370/158 using a CalComp 663 drum plotter.
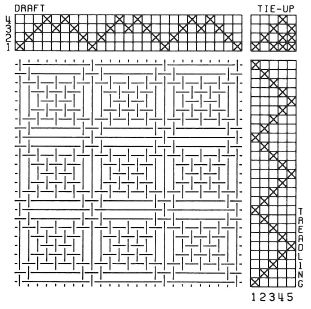
With this versatile tool for textile studies at my fingertips, I selected a variety of drafts with which to experiment, to see what could be learned about structure from the computer-generated illustrations. With the computer assuming responsibility for the tedious part of the processing, I found that in very little time I had generated many illustrations to study. Some examples are given in Figures 2-4.
Insights From Computer Diagrams
At first, I was disappointed that the computer diagrams did not have the striking impact of the traditional representation. This can be seen by comparing Figures 1 and 2, which are both of the same draft. I soon realized, however, that the reason for this lies in the built-in color bias of the traditional form. The cloth diagram on graph paper actually shows a white weft and a black warp, whereas both warp and weft are black in the computer version.
Here is clear evidence of the key role played by color in enhancing or suppressing the visual design possibilities of a given draft. Because the color bias is removed, the computer diagram is a more pure representation of fabric structure alone. Designing color schemes based on these diagrams is free of any predisposition toward built-in color properties.
I next found that the representation used in the computer illustrations actually encouraged me to examine the structure on a very detailed level, for example, by following the paths of individual threads. I saw new ways and means of tailoring yarn and color selections to a specific draft. In figure 2, for example, the warp threads on harnesses 1 and 2 follow a path of long skips; they are prominent in the structure. To take advantage of this, a fancy yarn could be threaded there to emphasize its decorative value; or, a certain color of yarn could be threaded there to emphasize its color value. These insights are due to the more realistic thread representation used in the computer diagrams.
As it happened, some of my computer illustrations were of drafts for which I had pictures of finished woven fabric. By comparing the illustrations with the pictures, the importance of what happens to fabric after it is removed from the loom was made very clear. For many weaves, the characteristic texture will develop only after the loom tension is removed and the yarns are allowed to relax into their new positions. Even simple plain weave "softens" in appearance as well as texture after removal from the loom; this softening is completed by the first washing of the fabric.
By studying the computer illustrations, this kind of softening of contours in the weave can be predicted. Areas of close thread interlacement will draw together proportionately more than areas of loose interlacement. For example, again in Figure 2, the 3-dimensional "waffle" characteristic of this weave will develop as the plain weave areas draw in together, further emphasizing the long skips in the areas of looser interlacement.
In an illustration showing many design repeats, these differing design areas can be readily recognized and their interrelationships examined. While it is tedious to diagram many repeats by hand, the computer program can diagram many as easily as one, thereby encouraging this kind of study.
Design Implications
As I studied the computer diagrams, I found myself looking at the weaving design process from a new perspective. My experiments showed me that structure is in itself a separate and crucial design element, one of three along with yarn and color. Each element must complement the others for the total design to be effective; the structure, yarns, and colors must all work together, whether each assumes a major or subordinate role.
The elements of yarn and color are shared by all the fiber arts—weaving as well as knitting, crocheting, knotting, twining, and braiding. The structural characteristics distinguish any one from any of the others. Anni Albers has suggested that the historical supremacy of weaving over the other fiber arts was due to the ease with which weaving structure lent itself to mechanization.5
Further Developments
Because the program was so convenient to use, I continued to make plots regularly to help with my own design work. I often went down to the machine room to watch the plots in progress, and seeing the partially finished plots suggested further developments which might be attempted. An interesting effect was created when only the weft threads had been plotted, and the warp not yet laid across it. What if some program options were added so that only the weft would be plotted, and that plotted very heavily? Would this approach simulate the design appearance of weaving systems, such as colonial overshot, where a dark weft forms a pattern against a light background warp?
For such systems, there are traditional ways of weaving which give a standard structure and texture; the design problem for these systems is one of creating and/or adjusting a pattern to pleasing proportions. Although the emphasis would be entirely opposite to what I had already done (concentrating on color differences rather than removing them), I could pursue this new approach with minor extensions to the existing program.
A most interesting problem arose while making these extensions. The program required considerable adjustment to give the desired visual effect. When the weft lines were too long or too thin, the pattern was lost in a jumble—even though I knew what pattern to look for, my eye could not resurrect it. As I tuned the plotting by shortening and widening the lines, the pattern emerged, at first tentatively and finally with great clarity. In fact, for sheer drama, it would be hard to improve on the new plot style.
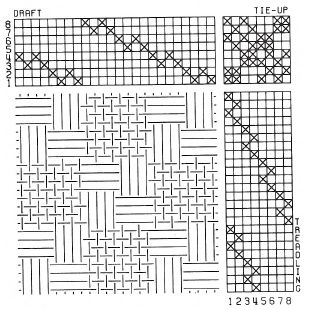
Once the plotting was in adjustment, I quickly generated diagrams in several systems. Colonial overshot, which is of considerable historic importance, is represented in Figure 5. When selecting such a draft, the weaver needs to know which part of the draft corresponds to which part of the pattern motif; or, the weaver wants to coordinate a pattern with a border motif, and needs to know how the two will fit together. The new style of plots meets these needs. Figure 5 also shows the optical illusion quality found in many overshot patterns, and can be viewed as an interesting design independent of a weaving interpretation.
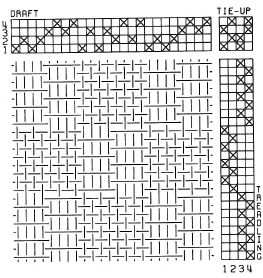
A system such as summer and winter has several classic textures, all slight treadling variations of the same basic threading. In order to understand the differences between them, they can be plotted and compared as in Figure 6. Then there are basic threadings which have virtually limitless variations with a large range of potential patterns. Instead of weaving samples of these pattern variations, it is possible to plot samplers showing the many possibilities. Such a sampler for Weaver's Fancy is shown in Figure 7.
With the addition of this new feature, the program has become quite a versatile learning and design tool. The value of computer weaving lies both in the automatic nature of the program as well as in the visually meaningful diagrams possible via the plotter. This creates for the designer-weaver an opportunity rich for exploration where creative energies may be concentrated in creative experimentation. Charles Babbage would no doubt be pleased to see that modern computers are repaying the long-standing debt they owe to weaving in the currency of applications such as this.
Manhattan, Kansas
September 1975
REFERENCES
1. Lourie, Janice. Textile Graphics/Computer-Aided. New York: Fairchild Publications, 1973.
2. Velderman, Pat. "Computer Generated Overshot Variations." Hand-weaver and Craftsman. Fall, 1971. Pgs. 10–11.
3. Babbage, Charles. Charles Babbage and His Calculating Engines. Ed. Philip and Emily Morrison. New York: Dover, 1961.
4. Frey, Berta. Designing and Drafting for Handweavers. New York: Macmillan Company, 1958. Chapts. 1–2.
5. Albers, Anni. On Weaving. Middletown, Connecticut: Wesleyan University Press, 1965.
FOOTNOTE
* This paper was published in part under the title "The Computer Learns to Weave" in Shuttle Spindle & Dyepot, Fall 1975. It is reprinted here with the permission of the Handweavers Guild of America, Inc., Copyright 1975, all rights reserved.
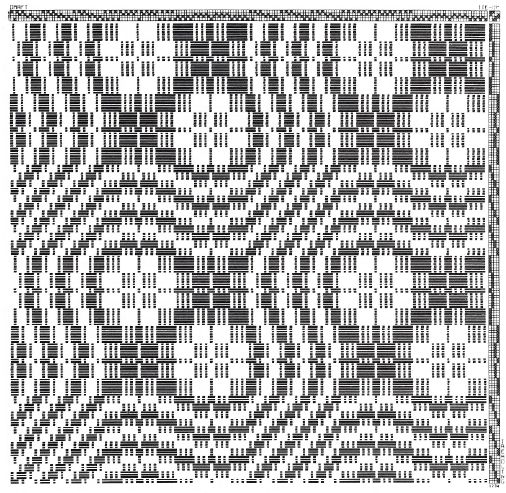
figure 5: 'Cat Tracks'.
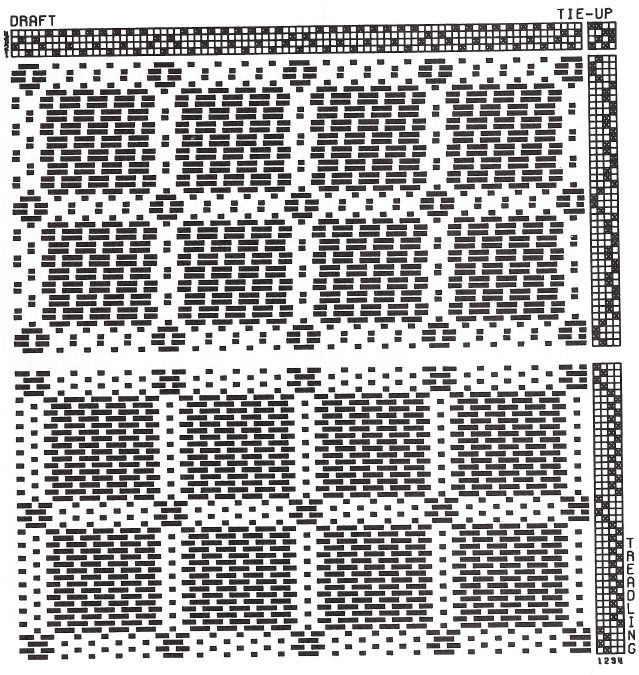
figure 6: 'Summer and Winter'.
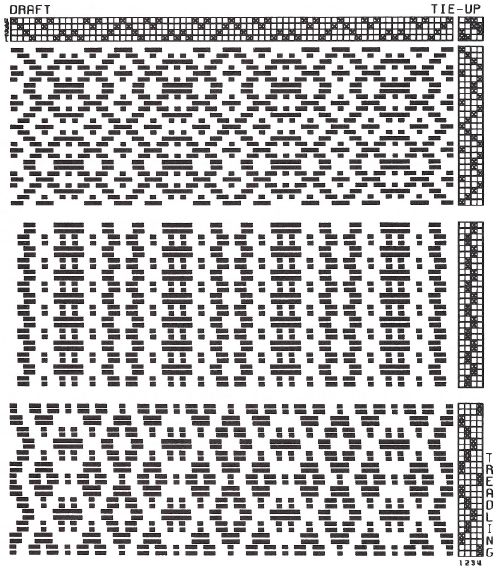
figure 7: 'Weaver's Fancy'.
Return to Table of Contents | Previous Section | Next Section