CHARLES CSURI
STATISTICS AS AN INTERACTIVE ART OBJECT
There are many instances where artists have used the direct analysis of nature (real-world data) to create art. One example is Monet, who worked directly from nature developing relationships of color and light based upon new theories of color. Cezanne's art also epitomized an expression of formal color relationships inspired by external objects or scenes. Artists like Picasso, Duchamp, and later in the mid-1950's and early 1960's, Rauschenberg and Segal used real-world objects in their art. Objects such as a bicycle seat, a chair, an automobile door or a coke machine combined with other materials were used to create a new context for expression. With Kaprow's 'Happenings' one appreciates further extensions of real-world data to include total environments and society as art. The Conceptual Art movement represented other methods and attitudes about objects, abstraction and art—for example, the use of words boldly written on large blueprint paper describing the physical characteristics of a hand; the words themselves and the blueprint become the art object cuing a mental picture of the hand.
Artists are constantly re-evaluating nature (real-world data) searching for new modes to express some personally felt view of the world and their relationship to it. One might suggests artists utilize real-world data to express a view of reality through the application of transformations to this data.
Data for artistic expression includes the numerical or statistical representation of the external world. As a mass society, we are constantly measuring and evaluating ourselves in order to understand our problems and our needs. We have statistics which are constantly being updated about unemployment, crime, traffic accidents, divorce, mental illness, birth and death, alcoholics, acreage of green space, pollution, longevity ... and many more.
There is a need to understand and solve complex social problems. Through the advent of computer technology, we have developed an enormous capacity to create large data-bases and programs that print out mountains of statistical information. While this capacity is a phenomenal one, we generally have difficulty in knowing how to interpret such data. This data can be extremely complex, especially as one deals with trends, multivariant relationships, dispersion and variation. Many social scientists choose to limit themselves to numeric representations of such data in the belief that this represents a position of neutrality or objectivity. Biderman1 and a relatively small group of researchers claim that there is a critical need to improve communication and understanding of this information. Improved visual presentation techniques can help us make more rational decisions about how to use resources and solve social problems.
Statistics is a way of making quantitative measurements and looking at reality. Rather than looking to the visual form or the external appearance of reality, the artist can now deal directly with content. It is a new conceptual landscape with its mountains, valleys, flat spaces, dark and light with gradations of texture and color. With computers, the artist can look at statistics representing real-world data about every facet of society—its problems reflecting tragic, comic and even surrealistic viewpoints. The artist has opportunities to express his perceptions of reality in a new way.
Interactive computer graphics offers a mode of interacting with information which is direct, making the numeric representations of data more communicative. The user can interact with mathematical models that simulate social systems or abstract processes or even aesthetic objects. Through computer animation/graphics, the user is given dynamic and pictorial means to view the process of change that is a consequence of his intervention. This enables the user to better understand the complex relationships that produce the results for which his intervention is responsible.
Additional software capabilities provide the user with the ability to modify system parameters through interactive devices and to alter curvilinear relationships without ever having to think of numbers. The simulation model is the same, but its value has been improved by reducing the demands it makes on the user's prior knowledge.
Many of the techniques used in the people-machine communication problems can be applied to computer art and simulations related to aesthetic concerns. Most people are inclined to think of computer art as either static graphics or animated film. In a few instances, physical art objects interfaced to a computer involving sensors reacting to light, sound or heat modify some component in the object establishing a new set of relationships. Another alternative is to view computer art as a real-time object involving user participation and control. The real-time computer art object is an intellectual concept which is made manifest in a visual experience rather than in a finalized material object. This kind of computer art exists only for the time the participant and the computer with a CRT display are interacting as a process. The art object is not the computer or the display, but the activity of both interacting with the participant. In addition to its artistic parameters, the content of this art form is dependent upon the dynamics of a real-time process which gives vitality and life to the visual display through animation and user interaction. Instant visual feedback for the purpose of examining alternatives is another important feature of such objects. Each participant is afforded the opportunity to experience the aesthetic object at a unique level depending upon his background and training.
Real-time computer art systems are designed so that the aesthetic experience is realized for the user through participation. The passive 'viewer' must become an active 'participant' in the actual context provided by the system. A case can be made for the idea that art can alter perception, and that since perception is an active organizing process rather than a passive retention-of-image causation, only by actively participating with the art object can one perceive it—and thus, in perceiving it, change one's reality structure.
A practical illustration of a real-time art object which uses a real-world data base is an interactive system involving animation/graphics and a statistical algorithm. The algorithm was developed into a computer program and a general explanation is offered as background material.
The AID (Automatic Interaction Detector) program was originally developed in 1963 at the University of Michigan. It can potentially be used in any analysis in which one is attempting to explain the variance of the dependent variable as some combination of independent or predictor variables. The program differs from the conventional multiple regression techniques in that no assumptions about the linearity of the model need be made, and that the predictor variables may exhibit many types of interactions without invalidating the analysis.
The AID technique is able to examine the interrelationships of up to 140 predictors. One of the variables is selected as a dependent variable. The technique repeatedly partitions the data into two groups to minimize the error sums of squares of the dependent variable. The output of the program is essentially a tree which summarizes the splitting process which took place. The symmetry or non-symmetry of the resulting tree reflects the interactions of the predictors. The tree may then be plotted on a CRT. A number of user-specified terminating conditions can cause the splitting process to stop. The output of the AID technique is generally presented in reports in the form of trees where each node in a tree represents a set of observations with a particular combination of values in the predictor variables. The mean value of the dependent variable, the number of observations, the predictor values, and the standard deviation is generally included for each node.
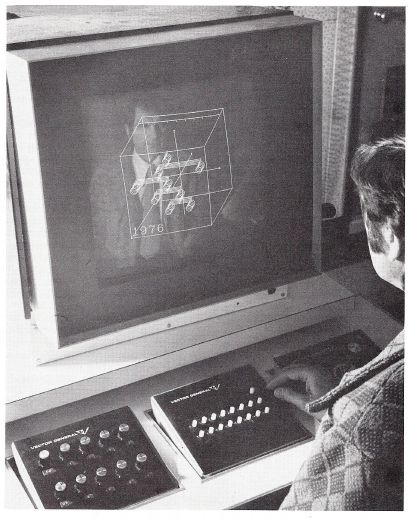
The following description of the interactive graphics has been implemented and it is a simulation based upon the AID program. The participant or user is seated in front of the CRT which is interfaced to a computer, and there are interactive devices such as dials, function keys, light pen, joystick, 3-D sonic pen and a keyboard. (The computer is a PDP-11/45 and the graphics display is a Vector General.)
This graphics simulation model starts by growing an AID tree and the user watches for relationships between variables as the tree is created. As is the case with the AID program, there is an order to the growth of the tree. Lower branches of the tree can be deleted if the user desires to reverse this process. One has stored in the computer a simulation of the history (past and projected future) of (real-world data) like key frames in an animation sequence. Through techniques of linear interpolation, smooth and continuous movement through time is achieved. The joystick enables one to control time and by pushing it forward, the user moves forward in time and by pulling it backward, time is reversed. On the CRT, the user has a clock at the lower portion of the screen; a two-dimensional scale is located at the top; and an AID structure is located in the middle. As the user moves the joystick, the structure changes shape and position, the clock moves, for instance, from 1024 to 2048—all of this dynamically in real-time. By pressing a function key and moving the joystick, the user can select a single variable and move it forward or backward through time. The same procedure is used for both linear and shaded pictures. The graphics can dynamically show a critical path development indicating a route to the most important variable in the data; the lines brighten as the path is developed.
Three-dimensional data representation is also used in this model. The tree structures are layered or stacked through the Z axis with each slide representing intervals of time (5 to 10 years) inside a unit cube. A surface is created by connecting lines between slices of time. The front face of the cube represents current time and the surface behind the face shows the history. The user can rotate the three-dimensional model and with the joystick control one can simulate moving through time and the thickness of the layers can symbolize other factors. Then one can rotate the structure to an angle where one can see the top view. This illustrates in more conventional terms, the typical chart with a scale for time along one axis and the percentage of the data along another axis.
While the AID program is represented by a tree structure, some algorithms might use a model of molecular structure. The structure would grow and change color maintaining connectivity with the thickness and color of the connections conveying pertinent information. One could use various geometric objects to represent kinetic models that involve multiple objects and surfaces. Then one could interactively move them through 3-D space and they could change color, shape and size with the speed of movement indicating relationships in the data. Some objects could be represented in a computer program such that they might seem to be made of an elastic material. A function key might indicate some variable to the program. With a 3-D sonic pen and a stereo pair viewing system, one could 'touch' the elastic object and it would dynamically change its shape; using another variable it would change shape differently with the shape itself conveying meaningful data.
The Computer Graphics Research Group at The Ohio State University has as one of its research goals the software development for color video display graphics as a tool for research scientists. The same hardware and software system could be linked to two-way cable TV. On remote TV sets and terminals, audiences could participate with a statistical art object.
While the original motivation of the visual representation of statistical data (kinostatistics*) is intended to help in the analysis and communication of societal problems, it has great potential as material for artistic expression. Artists have a significant role in the social science aspects of such concerns, but they can also approach real-world data from a purely artistic position to express their views of reality.
Columbus, Ohio
September 1975
ACKNOWLEDGMENTS:
I am especially indebted to the Computer Graphics Research Group for the software and hardware developments which made this experiment possible. Ronald Hackathorn and Allan Myers did the programming for the interactive AID simulation model. George Tressel brought the AID program to my attention and his comments and suggestions are greatly appreciated. The National Science Foundation provided the basic support for the CGRG under grant number DCR 74-00768A01 for the development of real-time animation/graphics techniques as a tool for the research scientist.
FOOTNOTE
* "Kinostatistics for Social Indicators," by Albert D. Biderman, Bureau of Social Research Report, 1971.
Return to Table of Contents | Previous Section | Next Section