The Basics Of Atari Graphics
Tom R. Halfhill
If you are new to the Atari and have acquired a bit of familiarity with BASIC, but have not yet taken the plunge into graphics, this article will introduce you to the fundamentals.
For some reason, many people are intimidated by the programming steps required to create computer graphics. Probably this is because creating computer graphics is not as easy as it looks. The typical buyer of a personal computer is dazzled in the store by all the fantastic arcade games and impressive graphics demos with which the sales people are armed. It all looks so simple. Then the buyer eagerly unpacks the computer at home and quickly discovers that even crude pictures cannot be created without screenfuls of cryptic programming that seemingly have more in common with Sanskrit than English.
But there is hope. It's not really that hard--honest. Nobody is promising that you'll be able to duplicate Star Raidersor PacManany time soon, but the basics of computer graphics are quite easy to grasp for anyone who has some knowledge of BASIC programming. You don't need to be a math wizard, either. The most valuable attributes are a willingness to learn and to experiment. And, of course, to be creative.
Choosing A Graphics Mode
Atari graphics are particularly challenging to learn, mainly because the Atari computers have extremely versatile graphics. Luckily, Atari made it easier for us by including many special keywords in Atari BASIC that are dedicated to graphics. The first step, then, is to learn those keywords. And by the way, if you don't already have your Atari BASIC Reference Manualhandy, take a second to grab it. This book and the Manualshould help to explain each other.
The most basic of the keywords is the GRAPHICS command. This tells the computer which graphics mode you want, which in turn determines how the screen will look. The format is GRAPHICS (aexp), where (aexp) is any arithmetic expression that results in a positive integer (in other words, not a negative number or a fraction). For example, GRAPHICS 6 is a valid command which tells the computer you want graphics mode six. GRAPHICS 3 + 3 or GRAPHICS 3*2 would do the same thing.
Depending upon how old your Atari is, the GRAPHICS command gives you access to either nine or twelve different graphics modes. The reason for the difference is that earlier Ataris (generally, those shipped before late 1981) came with a TV controller chip called the CTIA. Later Ataris have a GTIA chip instead. The chips are fully compatible--programs written on CTIA Ataris will run on GTIA machines and vice versa--but the GTIA adds three new graphics modes. Users with CTIA chips can have their computers upgraded if they wish. (See "Atari Video Graphics And The New GTIA" in Chapter 6.)
So, you have either nine or twelve basic graphics modes to choose from. In addition, most of them have two variations, for a total of up to 20 modes.
The modes are of two main types: pure graphics modes and text modes. The first three modes--GRAPHICS 0, 1, and 2--are text modes. When you switch on an Atari with a BASIC cartridge plugged in, it defaults to GRAPHICS 0. GRAPHICS 0 has 24 horizontal rows of up to 40 characters each on the screen. (If you've counted only 38 characters, it's because the left margin is pre-adjusted to allow for TVs which overscan, or cut off the left edge of the screen image.) GRAPHICS 1 and 2 display larger-size characters. GRAPHICS 1 characters are the same height as those in GRAPHICS 0, but are twice as wide. GRAPHICS 2 characters are not only twice as wide, but also twice as tall.
The graphics modes generally used for creating pictures are GRAPHICS 3 through 8 (3 through 11 on GTIA machines). GRAPHICS 3 through 8 are mixed modes. That is, they are combinations of text and graphics modes. For example, type GRAPHICS 3 into the Atari. You'll see a black screen with a small blue rectangle at the bottom. That rectangle is called the text window. Although the upper part of the screen is a graphics mode for drawing pictures, the text window is a section of GRAPHICS 0 for displaying text. Think of it as the term implies: a "wall" of GRAPHICS 3 with a "window" of GRAPHICS 0.
The GRAPHICS 0 text window appears in all the graphics modes from three through eight. Separate commands, which we'll soon learn, are required to display graphics or text in each part of those screens.
If you want a "pure" graphics mode--a full screen for graphics with no GRAPHICS 0 text window--simply add 16 to the mode number of the GRAPHICS statement. For example, GRAPHICS 3 + 16 switches the screen to GRAPHICS 3 without a text window. Some programmers would type GRAPHICS 19, which is the same thing. Adding 16 works for all the modes except GRAPHICS 0, which ordinarily cannot display a separate text window.
Just Like Graph Paper
You may be wondering why there are so many graphics modes, and how to choose among them. The modes differ in three main ways: resolution, number of colors available, and memory consumed.
First, resolution. Think of the graphics screen as a sheet of graph paper. Some graph paper is divided into very small squares; other graph paper has larger squares. If you had to draw a picture on graph paper only by coloring in the squares--not by sketching lines--the graph paper with the smaller squares obviously would allow you to create a more detailed picture. It would allow greater resolution.
This is exactly how a computer screen works. The screen is divided into tiny squares, and graphics are created by "filling in" those squares. These squares are sometimes called pixels, for "picture elements." In the highest resolution modes, the pixels are so small that they do not appear as squares at all, but as tiny dots.
The Atari graphics modes offer different resolutions. The higher the graphics mode number, the greater the resolution. So you can draw much more finely detailed pictures in GRAPHICS 8, for instance, than in GRAPHICS 3. In GRAPHICS 8, there are 320 horizontal pixels (or "graph paper squares") per row on the screen; GRAPHICS 3 has only 40. So GRAPHICS 8 has a horizontal resolutionof 320 and GRAPHICS 3 has a horizontal resolution of 40.
When figuring the vertical resolution, don't forget about the text window. These four lines of GRAPHICS 0 at the bottom of the screen take up room that could be used for drawing pictures; thus, it decreases the vertical resolution. Adding 16 to the graphics mode number regains that resolution. So GRAPHICS 3, for example, has a vertical resolution of 20 pixels; GRAPHICS 3 + 16 has 24 pixels.
Table 1 shows the resolutions of the graphics modes with and without the text window.
Another difference is color. GRAPHICS 2 (the double-height, double-width text mode) normally can display characters in five colors at a time. GRAPHICS 4 and 6 can display only two colors. These differences also are shown in Table 1.
The final main difference between the Atari graphics modes is the amount of Random Access Memory (RAM), or user-available memory, they consume. You may have guessed that the first two characteristics--resolution and number of colors determine the third. The higher the resolution, and the more colors available, the more memory is required. We won't delve into the details, but it's enough to know that the computer must keep track of what it is displaying, so the more it displays, the more memory it needs.
You don't have to worry about allocating the memory yourself; the computer automatically seizes the memory it needs when a GRAPHICS statement is executed. But you do have to worry about how much memory you have left. A 16K RAM Atari, for example, normally has about 13,300 of its 16,000 memory bytes free when first switched on (the remainder is also allocated by the computer for other uses, but we won't go into that here). Entering GRAPHICS 8 instantly chops that down to about 5200 bytes, or 5.2K, because GRAPHICS 8 requires about 8000 bytes just to set itself up. That doesn't leave much room for an involved program. In fact, the original 8K Ataris cannot even enter GRAPHICS 8 without memory expansion.
Again, Table 1 shows how much memory each graphics mode consumes.
The Chameleon Computer
When we said before that the graphics modes are limited to displaying a certain number of colors, we didn't mean that you're stuck with the same colors all the time. Like a chameleon, the Atari can change its colors at will--your will.
How many colors can you choose from? If you have an older CTIA chip in your machine, up to 128 colors are possible. With the new GTIA, there are 256.
These break down into 16 basic colors, with variable shades (or luminances) to achieve the 128 or 256 hues.
However, without resorting to the kind of special tricks described in the more advanced chapters of this book, a much smaller number of colors is available simultaneously.
All the graphics modes default to certain colors. It's easy to change these colors, though, with the SETCOLOR statement. The format is SETCOLOR (register), (hue), (luminance). These three values can be arithmetic expressions, but should evaluate to whole numbers. In addition, the values have certain ranges.
(Register) is a number from zero to four. The "registers" are really memory locations which control the screen colors. The foregrounds, backgrounds, and borders of the graphics modes are in turn controlled by these registers. For example, the backgrounds of GRAPHICS 1 through 7 are controlled by register four; since register four defaults to black, the back grounds of those graphics modes appear on the screen as black.
(Hue) allows you to change that default color. You just plug in a color number from zero to 15 (remember, we said there were 16 basic colors). Table 2 shows the color numbers, and Table 3 the default colors for the registers.
(Luminance) simply adjusts the brightness, or shade, of the color selected by (hue). This must be an even number from zero to 14, with zero the darkest and 14 the brightest.
So, to change the background of GRAPHICS 3 from black to green, you could enter SETCOLOR 4,12,8.
That's it. You can change the color of any color register this way.
Drawing Pictures, At Last
We haven't forgotten that the whole reason you're reading this book is that you want to create graphics. But we had to get the basics out of the way first. Now for the nitty-gritty.
The graph paper analogy really comes in handy here. In fact, some actual graph paper often is an indispensable aid when you're planning complex drawings for a screen.
Picture the graphics screen again as a sheet of graph paper. Depending on the resolution of the graphics mode, the screen has certain coordinates. For instance, GRAPHICS 6 without the text window (that is, GRAPHICS 6 + 16) has a horizontal resolution of 160 pixels and a vertical resolution of 96. Since computer work often involves counting from zero instead of one, the horizontal coordinates range from zero to 159, and the vertical coordinates from zero to 95. Lock the applicable coordinates in your head whenever working with a graphics mode, because if you exceed them, you'll encounter the dreaded ERROR- 141, CURSOR OUT OF RANGE.
Now, we said before that you didn't have to be a math wizard to program computers, and we meant it. In fact, plotting graphics coordinates is one case where a knowledge of higher math is actually a detriment. Mathematicians usually plot coordinates starting from the lower-left corner of a graph; computer designers start at the upper-left corner. So, according to the coordinate system we just described, position 0,0 is the upper-left corner of the TV screen in GRAPHICS 6, and all the graphics modes.
Look at the figure; it shows how the coordinates run in GRAPHICS 6 + 16. This is the same for all the modes, except that the upper limit of the coordinates will differ according to each mode's resolution. Coordinate position 159,95 is the lower-right corner in GRAPHICS 6 + 16; in GRAPHICS 5 + 16 it would be 79,39; and in GRAPHICS 8 + 16, 319,191. (The horizontal, or X, coordinate always precedes the vertical, or Y, coordinate.)
It's vital to understand how this coordinate system works; it is the basis for all drawing and positioning on the screen.
For example, to draw a dot on the screen, you "light up" or "switch on" the pixel at that location, according to its coordinates. This is done with the PLOT statement. The format is PLOT X,Y- where X is the horizontal coordinate and Y is the vertical coordinate. PLOT 0,0 will put a dot in the upper-left corner of the screen. The size of that dot depends on the graphics resolution; the higher the resolution, remember, the smaller the dot. PLOT 159,95 would draw a dot ("switch on a pixel") at the lower-right corner of the screen in GRAPHICS 6 + 16.
To draw a line, you could simply PLOT a number of dots in a row. For instance, PLOT 2,4:PLOT 2,5:PLOT 2,6 etc., would draw a short vertical line near the left edge of the screen. But there's an even easier way: the DRAWTO statement. The format is DRAWTO X,Y. DRAWTO does just what it implies; it draws a line to the horizontal and vertical coordinates specified. Before using DRAWTO, however, you have to include a PLOT statement to give the DRAWTO a starting point. Afterward, DRAWTO will pick up where it left off. For instance, you could draw a square like this:
10 GRAPHICS 6 + 16:COLOR 1:PLOT 5,5:DRAWTO 10,5:DRAWTO 10,10:DRAWTO 5,10:DRAWTO 5,5
Drawing In Different Colors
You probably noticed the COLOR statement in that last example and wondered where it came from. A COLOR command is necessary before executing any PLOTs or DRAWTOs. If you leave it out, the PLOTs and DRAWTOs will be displayed in the background color, rendering them invisible. The COLOR statement, then, selects the color for subsequent PLOT and DRAWTO statements. The format is COLOR (aexp), where (aexp) is any arithmetic expression that evaluates to a whole number (fractions are automatically rounded). Further, that number should be from zero to three.
Important: don't confuse COLOR with SETCOLOR. SETCOLOR selects the foreground, background, and border colors to be displayed by the color registers, while COLOR determines the color of points or characters to be plotted on the graphics screen. Since COLOR is the foreground (plotting) color, it can be changed with SETCOLOR.
A useful analogy is to think of the colors available on the Atari as a box of crayons (128 crayons with CTIA machines and 256 crayons with the GTIA chip). SETCOLOR allows you to select a handful of those crayons at once--the exact number depending on the graphics mode (see Table 1). In GRAPHICS 6 you can select two. Once you've chosen the crayons, COLOR allows you to choose which crayon the computer will use for subsequent PLOTs and DRAWTOs. At any time, you can execute COLOR to switch among the crayons in your hand, or SETCOLOR to replace the crayons in your hand with other colors from the box. But don't carry the analogy too far--when you change colors with SETCOLOR, everything you've already drawn changes color, too.
For example, in GRAPHICS 7, the color selected by the statement COLOR 1 is determined by the value in SETCOLOR register zero. The default color is orange. So if you PLOT and DRAWTO in GRAPHICS 7 with COLOR 1, the figure will appear orange. To get a green figure, you would execute SETCOLOR 0,12,8:COLOR 1:PLOT, etc. The SETCOLOR statement would change color register zero from orange to green, and COLOR 1 would use the new color for all subsequent PLOTs and DRAWTOs.
Note that any previous figures plotted in orange would change to green instantly upon execution of the new SETCOLOR. This system is known as color indirectionand accounts for the flashing screen colors you may have noticed in those fancy graphics demos you've admired. Yet, as you see, the technique is really very simple.
One thing that takes some getting used to is that the COLOR statement does not get its color from the same registers in all graphics modes, and some modes are restricted to only two colors. Refer to the table on page 53 of the Atari BASIC Reference Manualfor a summary of how COLOR and SETCOLOR take effect in the various modes.
More Graph Paper
That graph paper analogy comes in handy again for two more graphics statements you'll need to learn.
The first is POSITION. The format is POSITION X,Y where X is the horizontal coordinate of the graphics mode and Y is the vertical coordinate. POSITION is a lot like PLOT, except it doesn't draw anything. That is, POSITION X,Y directs the computer's attention to point X,Y on the screen just as PLOT X,Y does, except the pixel at that point is not "switched on." Instead, the invisible graphics cursor--similar to the text cursor you're familiar with in GRAPHICS 0--is spotted at point X,Y in preparation for the next command.
This command could be a PRINT statement in one of the large text modes, GRAPHICS 1 or 2. For example, GRAPHICS 2:POSITION 5,5:PRINT #6;"HELLO" would print "HELLO" starting at column 5, row 5 on the GRAPHICS 2 graphics screen. ("PRINT #6;" merely specifies a PRINT to the graphics part of the screen; a PRINT statement without the "#6;" would print the message in the text window.) The POSITION statement is valuable for neatly formatting screens in your programs.
The LOCATE statement is another handy programming tool. The format is LOCATE X,Y,Z--again, where X and Y are the horizontal and vertical screen coordinates. The third variable, shown here as "Z," returns a value read from the pixel at point X,Y. That value depends on the graphics mode. In modes three through eight, the value is the color register in use (the SETCOLOR number) at that pixel position. In GRAPHICS 1 and 2, the large text modes, the value tells which character as well as which color register is in use at the pixel position. And in GRAPHICS 0, the value is the ATASCII code for the character at that location (ATASCII is the character code system; see Appendix C of the Atari BASIC Reference Manual).
Since LOCATE can determine what is being displayed at a certain location on the screen, it is sometimes used to detect collisions (or impending collisions) between objects in games. (See "Using The COLOR And LOCATE Instructions To Program Pong-Type Games," later in this book.)
Beginning Animation
At this point, if you've been practicing and experimenting with the principles we've covered so far, you know all the basics you need to draw figures and colorful designs on the graphics screens. But you're probably wondering how to animate those images.
Animation is perhaps the most difficult graphics technique to master. For one thing, fast, smooth animation requires a great deal of processing speed, sometimes more than is possible with a relatively slow language such as BASIC. But it is possible, and there are several methods. We won't cover any of them in depth here, but we will introduce you to the simplest forms to whet your taste a bit.
One method may already have occurred to you. By just drawing a figure on the screen, erasing it, and re-drawing it at a slightly different location, you can achieve the illusion of movement in the same way that cartoonists do. You already know how to draw a picture with PLOT and DRAWTO. Erasing it is just as easy--you simply re-draw the image in the background color, making it disappear. Then you switch back to the foreground color, re-draw the figure elsewhere, and presto--it will seem to have moved. Sometimes this is called playfield graphics. Try Program 1 for an example.
Similarly, the POSITION and PRINT statements may have suggested another simple method of animation. Consider the text modes, GRAPHICS 0, 1, and 2. While commonly used for "title screens" and other applications requiring text displays, they also come in handy for a technique called character graphics. To make the character "A" seem to move across the screen, for example, you PRINT it at the desired starting location, erase it by PRINTing a blank space in the same spot, and then re-PRINT it at the next location. POSITION lets you specify where the movement will start, and LOCATE can detect collisions with other characters.
All fine and good, you say, but why would I want to animate letters of the alphabet?
Have you ever noticed what happens when you hold down the CONTROL key and press an alphabetic key on the Atari? The resulting character is an odd shape of some sort. A number of these shapes are available, known as control characters. When PRINTed side-by-side, they can be put together to form robots, spaceships, or what-have-you. The POSITION and PRINT statements can supply the animation. This is sometimes called control graphics. Try Program 2 for an example.
Both of these methods--playfield graphics and control graphics--are straightforward and simple. Many fine games have been written in BASIC using these techniques. In fact, some computers have no other methods available. However, fast movement of complex figures does tend to get messy. Luckily, the Atari computers offer several more advanced techniques, such as redefined characters graphics (which allows you to sculpt that "A" into almost any shape you want), player/ missile graphics, page-flipping, and screen scrolling.
Those techniques are covered later in this book. This article was merely intended to arm newcomers to Atari graphics with the basic tools needed to understand the more esoteric subjects. When you run into roadblocks--and you'll encounter them as you forge ahead into the sometimes tricky world of computer graphics--just keep your manuals handy and remember this famous American proverb:
"When all else fails, read the instructions. "
Figure. Coordinates of GRAPHICS 6+16.
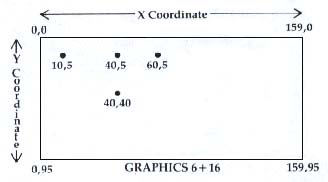
Table 1. Summary Of The Graphics Modes.
| Graphics Mode |
Resolution With Text Window |
Resolution Without Text Window |
Colors Available |
Memory Consumed |
| 0 | -- | 40 x 24 | 2 | 993 |
| 1 | 20 x 20 | 20 x 24 | 5 | 513 |
| 2 | 20 x 10 | 20 x 12 | 5 | 261 |
| 3 | 40 x 20 | 40 x 24 | 4 | 273 |
| 4 | 80 x 40 | 80 x 48 | 2 | 537 |
| 5 | 80 x 40 | 80 x 48 | 4 | 1017 |
| 6 | 160 x 80 | 160 x 96 | 2 | 2025 |
| 7 | 160 x 80 | 160 x 96 | 4 | 3945 |
| 8 | 320 x 160 | 320 x 192 | 2 | 7900 |
| 9 | -- | 80 x 192 | 16 | 7900 |
| 10 | -- | 80 x 192 | 9 | 7900 |
| 11 | -- | 80 x 192 | 16 | 7900 |
Table 2. Atari Color Numbers.
*Note: Color TVs may vary.
|
Color Number |
Color* |
| 0 | Gray |
| 1 | Gold |
| 2 | Orange |
| 3 | Red-Orange |
| 4 | Pink |
| 5 | Violet |
| 6 | Purple-Blue |
| 7 | Blue |
| 8 | Light Blue |
| 9 | Blue-Green |
| 10 | Turquoise |
| 11 | Green-Blue |
| 12 | Green |
| 13 | Yellow-Green |
| 14 | Orange-Green |
| 15 | Light Orange |
Table 3. Color Register Default Values.
*Note: Color TVs may vary.
| Register Number |
Color Number |
Luminance Number |
Color* |
| 0 | 2 | 8 | Orange |
| 1 | 12 | 10 | Green |
| 2 | 9 | 4 | Blue |
| 3 | 4 | 6 | Pink |
| 4 | 0 | 0 | Black |
Download P015L1.BAS (Saved BASIC)
Download / View P015L1.LST (Listed BASIC)
Download P015L2.BAS (Saved BASIC)
Download / View P015L2.LST (Listed BASIC)
Return to Table of Contents | Previous Section | Next Section