Henrique Veludo
One interesting type of program allows you to explore relationships between numbers and their visual analog. The routine here plots polar functions - this might not drive you wild until you realize that this means spirals and roses. A more seductive introduction to the beauty of math is difficult to imagine.
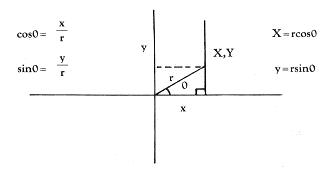
This program will plot polar functions such as roses, spirals, polygons, on the high screen of the ATARI 800, with input from the programmer. The general equations for converting the polar coordinates to rectangular coordinates are as follows:

First, the program will display a function menu (line 100), then ask the user to input which function to display, together with its parameters, INCR(element) and SC(ale). The INCR(element) is the interval in degrees that the computer uses to "increment" the angle T from 0° to 360° . One must decide whether the speed of execution or accuracy in plotting is preferable. A small INCR(element), e.g. 0.1, will draw a very accurate graph very slowly. A larger INCR(element), e.g. 5.0, will draw much faster and less accurately. An INCR of 1.0 is a good compromise. The SC(ale) is included to allow the graph to fill most of the screen. Without it, some functions will appear too small, others will be too large to plot. A SC(ale) between 10 and 100 should do for most functions. Lines 220 to 226 check for a 0 input that might confuse the program and display an error message. Line 230 asks if the x-y axes are to be displayed and lines 390-395 display them. Lines 300-370 will select random colors and intensities (with enough separation to be visible). Lines 400-690 contain the calculation and plotting routines for x,y. In line 410 the variable U is included for use with the spiral function and dictates how many revolutions the spiral will have; it can be changed at line 222. Line 420 converts degrees to radians (in this context the program seems to work better with radians, but it could be converted to degrees, with the DEG function, and changing the values of the functions). Line 430 will direct the program to the proper function chosen in the input. Lines 610-620 calculate the x,y coordinates. Line 630 will check for an out-of-range cursor, stop the drawing, and avoid an error message. Line 670 will activate the buzzer to signal that the plotting is over. Lines 680-690 wait for a key to be pressed to clear the screen and return to the menu. If the buzzer sounds without anything being plotted, it means that the function is too large to plot. (Decrease the SC(ale) value to continue.) I chose to use randomly-selected colors. They could be chosen by the user in an input statement as well (where you input the parameters after the menu display).
Here are some values for the functions that work beautifully:
R = Q:SC = 4:INCR = 60
R = 2(I-SIN(Q):SC = 20
R = COS(2 SIN(6 (Q))):SC = 90
R = SIN(COS(100 Q)):SC = 90
R = COS(2 SIN(2 Q)):SC=90
R = I:INCR=45:SC=60 polygon
R = 2(I + COS(Q)):SC = 20
R = SIN(3(Q)):SC = 80
R = SIN (4COS(2Q)):SC = 90
R = COS(3SIN(Q)):SC = 90
R = COS(SIN(100 Q)):SC=90
R = I:INCR = I20:SC = 80 triangle
Listing. Program to plot polar functions.
Download (Saved BASIC)
Download / View (Listed BASIC)
Return to Table of Contents | Previous Section | Next Section

